
How can we save lives effectively?
Climate and donations: orders of magnitude
Reducing our emissions protects lives. But how many, at the level of one person? And how many lives can a donation to a highly effective charity save? This tool sets the two side by side, drawing on published studies and with their uncertainties.
1. Your avoided emissions
How many fewer deaths by 2100?
Choose an action or enter your own figures.
Why such a wide range?
The estimates used already vary by a factor of four depending on the emissions scenario, the time horizon (2100 or 2300) and adaptation. And they leave out effects that work in both directions.
- What could make the toll heavier. The models used do not represent tipping points (permafrost thaw, methane hydrates, etc.). A study that adds them to economic models of the climate raises the social cost of carbon by around 25%, with roughly a one-in-ten chance that it more than doubles [21]. These estimates also do not count other health effects (infectious diseases, famines, conflicts).
- What could make it lighter. Rising wealth and adaptation (air conditioning, healthcare, heatwave alerts) reduce vulnerability to heat: this is the gap between the two 2025 versions [2]. Technical progress could go further: if one day we learn to remove CO2 from the air cheaply, a tonne emitted today could be removed later, and its effects reduced accordingly.
- What this changes. For individual actions, nothing: even multiplied by five, the deaths averted remain far below those achieved by a donation. For climate organisations that work on public policy (around €1 per tonne), the cost per death averted is of the same order as that of health charities: this is where the uncertainty is decisive.
2. A donation to a highly effective charity
How many lives saved today?
The top-rated global health charities according to GiveWell, which Mieux Donner recommends in France.
How much does one death avoided cost, depending on the route chosen?
Bar: central estimate; line: range. Logarithmic scale: each gradation is ten times the previous one. Tap or hover over a line for details.
For the climate: the price of one tonne avoided divided by the number of deaths avoided per tonne. Deaths avoided through the climate route occur mostly several decades from now; those prevented by health charities occur today.
What this means
- At the scale of an individual, the deaths avoided by reducing one’s emissions amount to fractions of a life, even for significant actions.
- To save lives with a given budget, a donation to a highly effective health charity achieves, on average, far more than most ways of paying to avoid emissions.
- Some climate organisations that work on public policy could come close to this effectiveness, but their estimates are much more uncertain.
What this does not mean
- That the climate does not matter. The studies here count only temperature-related deaths: not other health effects, nor economic losses, nor extreme risks, nor other species.
- That individual actions are useless. Added together, they weigh heavily: with the same assumptions, a single year of the carbon footprint of the French (around 560 million tonnes) corresponds to some 130,000 excess deaths (60,000 to 220,000). And a plant-based diet also spares, every year, about fifteen land animals, a few dozen fish and a hundred or so crustaceans, mostly prawns (a very wide estimate: from 30 to 250 per year): that much animal suffering avoided.
- That you have to choose. Reducing your emissions and donating are not mutually exclusive: the tool helps to measure what each one achieves.
Assumptions, settings and limitations
| Assumption | Value | Source |
|---|---|---|
| Excess deaths per tonne of CO2 emitted (reference estimate) | 1 per 4,434 t | Bressler 2021 [1]: temperature-related deaths, from 2020 to 2100, no-climate-policy scenario (+4.1°C in 2100) |
| Range used (central estimates from the various scenarios and versions) | 1 per 2,500 to 9,300 t | Bressler 2021 [1] and 2025 [2] |
| Cost of a life saved | 3 000 à 5 500 $ (2 700 à 4 900 €) | GiveWell [3]; $1 = €0.895 (ECB, 30/10/2026) |
| Actions: plant-based diet, living without a car, one fewer transatlantic return flight | 0.8; 2.4; 1.6 t/year | Wynes and Nicholas 2017 [4] (rich countries, averages) |
| Average footprint of a French person | 8.2 t CO2e/year | SDES, 2024 (provisional) [5] |
| Tax reduction | 66 % | Mieux Donner [6]: Against Malaria Foundation, Helen Keller Intl (up to 20% of taxable income) |
Limitations. A single researcher, R. Daniel Bressler, has published these estimates of deaths per tonne; their own margin of uncertainty extends to zero, or even below (fewer cold-related deaths), and, at the other extreme, to one death per 1,000 to 1,500 t. They count only temperature-related mortality. Gases other than CO2 (methane from livestock farming in particular) are converted into CO2 equivalent, which does not reflect their faster effect. GiveWell’s costs per life are past averages, expected to rise, and vary by country. The deaths compared are not of the same nature: children today on one side, people of all ages, often elderly, several decades from now on the other. Level of evidence: not assessed by APALA.
The same trade-off, at the scale of states
In October 2026, Our World in Data measured the share of official development assistance devoted to climate [7]. In 2024, around one fifth of aid is labelled ‘climate’: $50 billion, or a third of bilateral aid allocated to projects (18% in 2010). But if one counts only projects whose main objective is climate, this share falls from 34% to 13%.
With aid budgets falling, the question is the same as in this tool: a dollar earmarked for the climate may be missing from bed nets or nutrition. The data do not yet allow us to say whether ‘climate’ aid replaces health aid, or whether it is often merely a new label on projects that would have gone ahead anyway.
For the economist Bjørn Lomborg, president of the Copenhagen Consensus, and Indermit Gill, chief economist of the World Bank from 2022 to 2026, this is precisely the question that rich countries lose sight of [8]. In 2025, 48% of World Bank Group financing was counted as climate-relevant. Yet the most effective investments in health, nutrition and education often return $40 to $110 in benefits per dollar, according to work carried out with more than a hundred economists by the Copenhagen Consensus: $2.50 of micronutrients given to a pregnant woman, for instance, prevents stunted growth and returns nearly $100 for her child. ‘The poor are more vulnerable to everything’, they write: to disease, hunger and economic shocks, not just to climate. The World Bank has in fact measured this: a 10% increase in income per capita goes hand in hand with nearly 100 million fewer people highly exposed to climate hazards [9].
Their aim is not to abandon the climate: adaptation and green innovation, they write, are good investments. It is to start with what saves the most lives for each dollar, exactly what this tool does for a donation.
Climate and lives saved are not opposed. A good part of ‘climate’ aid also funds development, with climate often only a secondary objective, and 83% of the temperature-related deaths expected from today’s emissions would occur in low-income and lower-middle-income countries [2]. The useful question is not ‘climate or lives’, but: which spending, climate included, saves the most lives per euro?
Realities that coexist
Three findings are true at the same time, and none cancels out the others: living standards protect life; natural disasters kill far fewer people than a century ago; global warming makes some extremes more frequent, heat first of all. Looking at them together helps us understand why climate and development are not opposed.
1. Living standards, the first line of defence
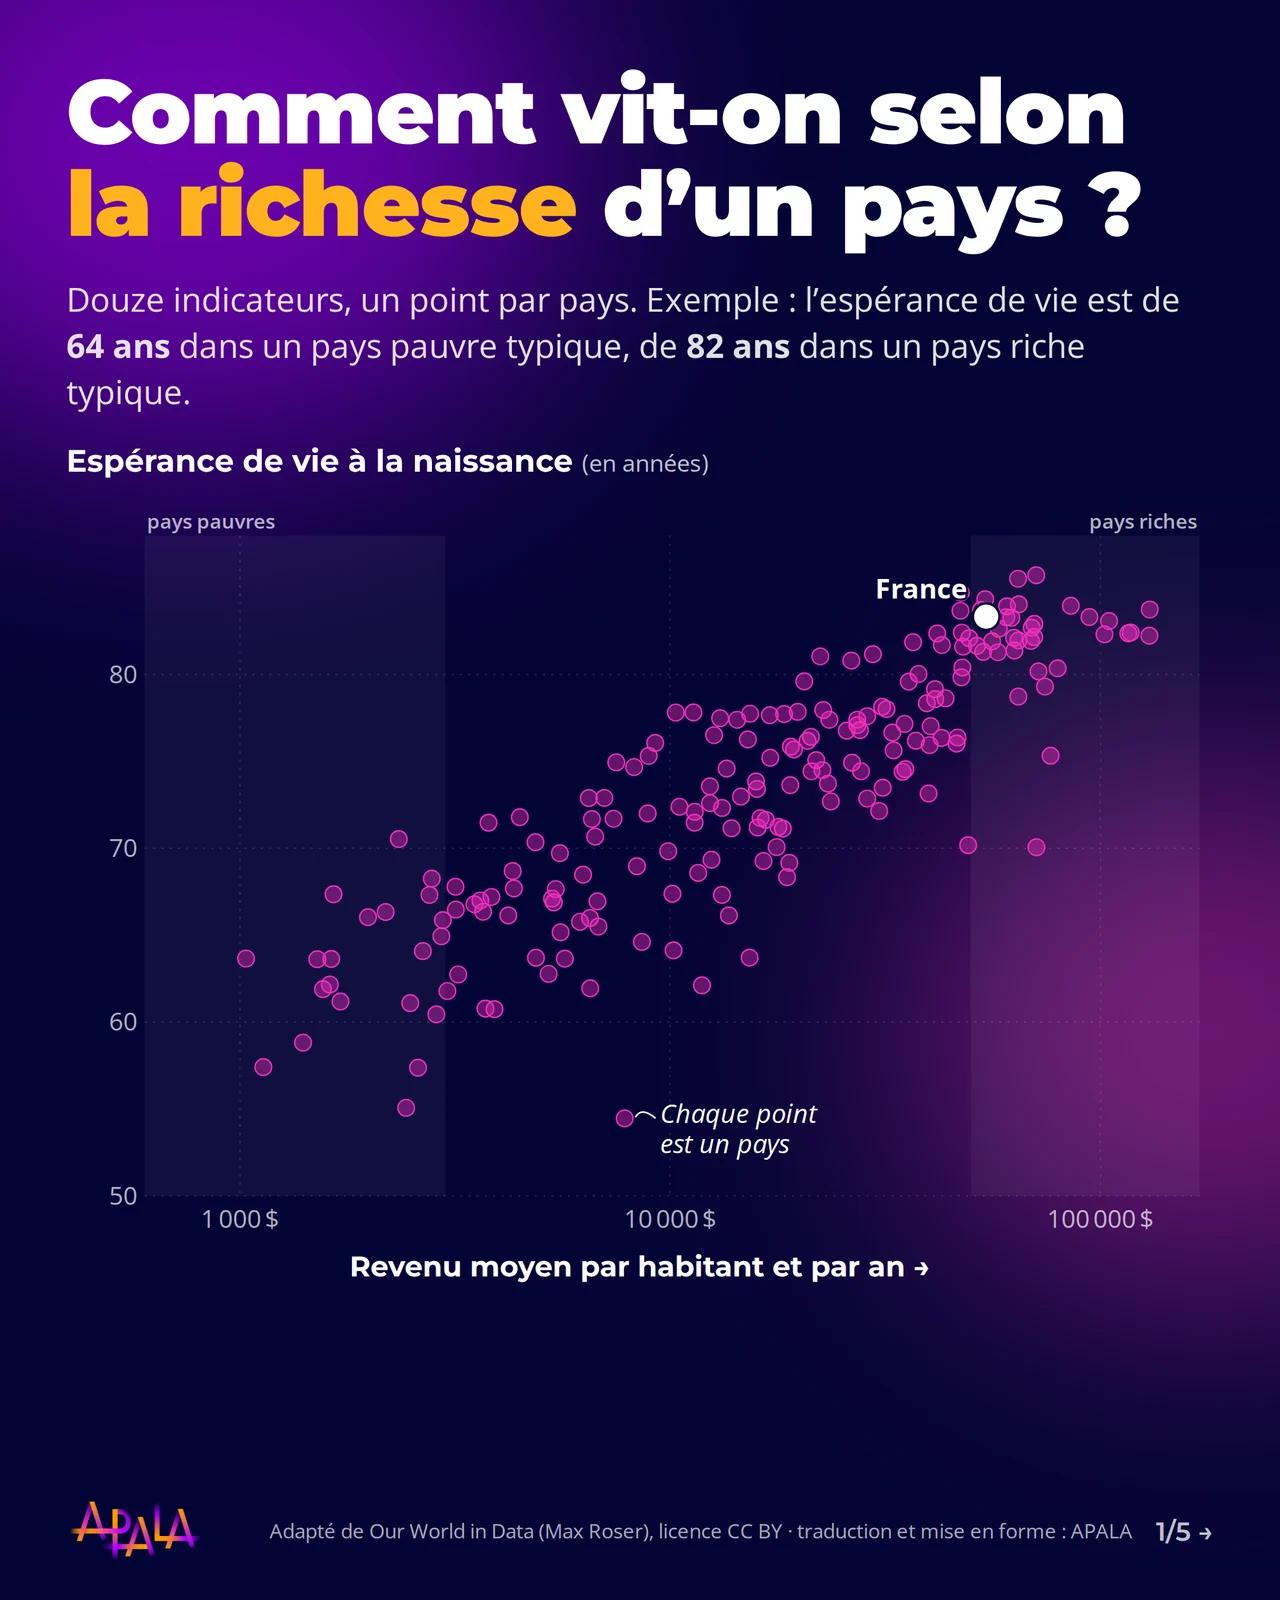
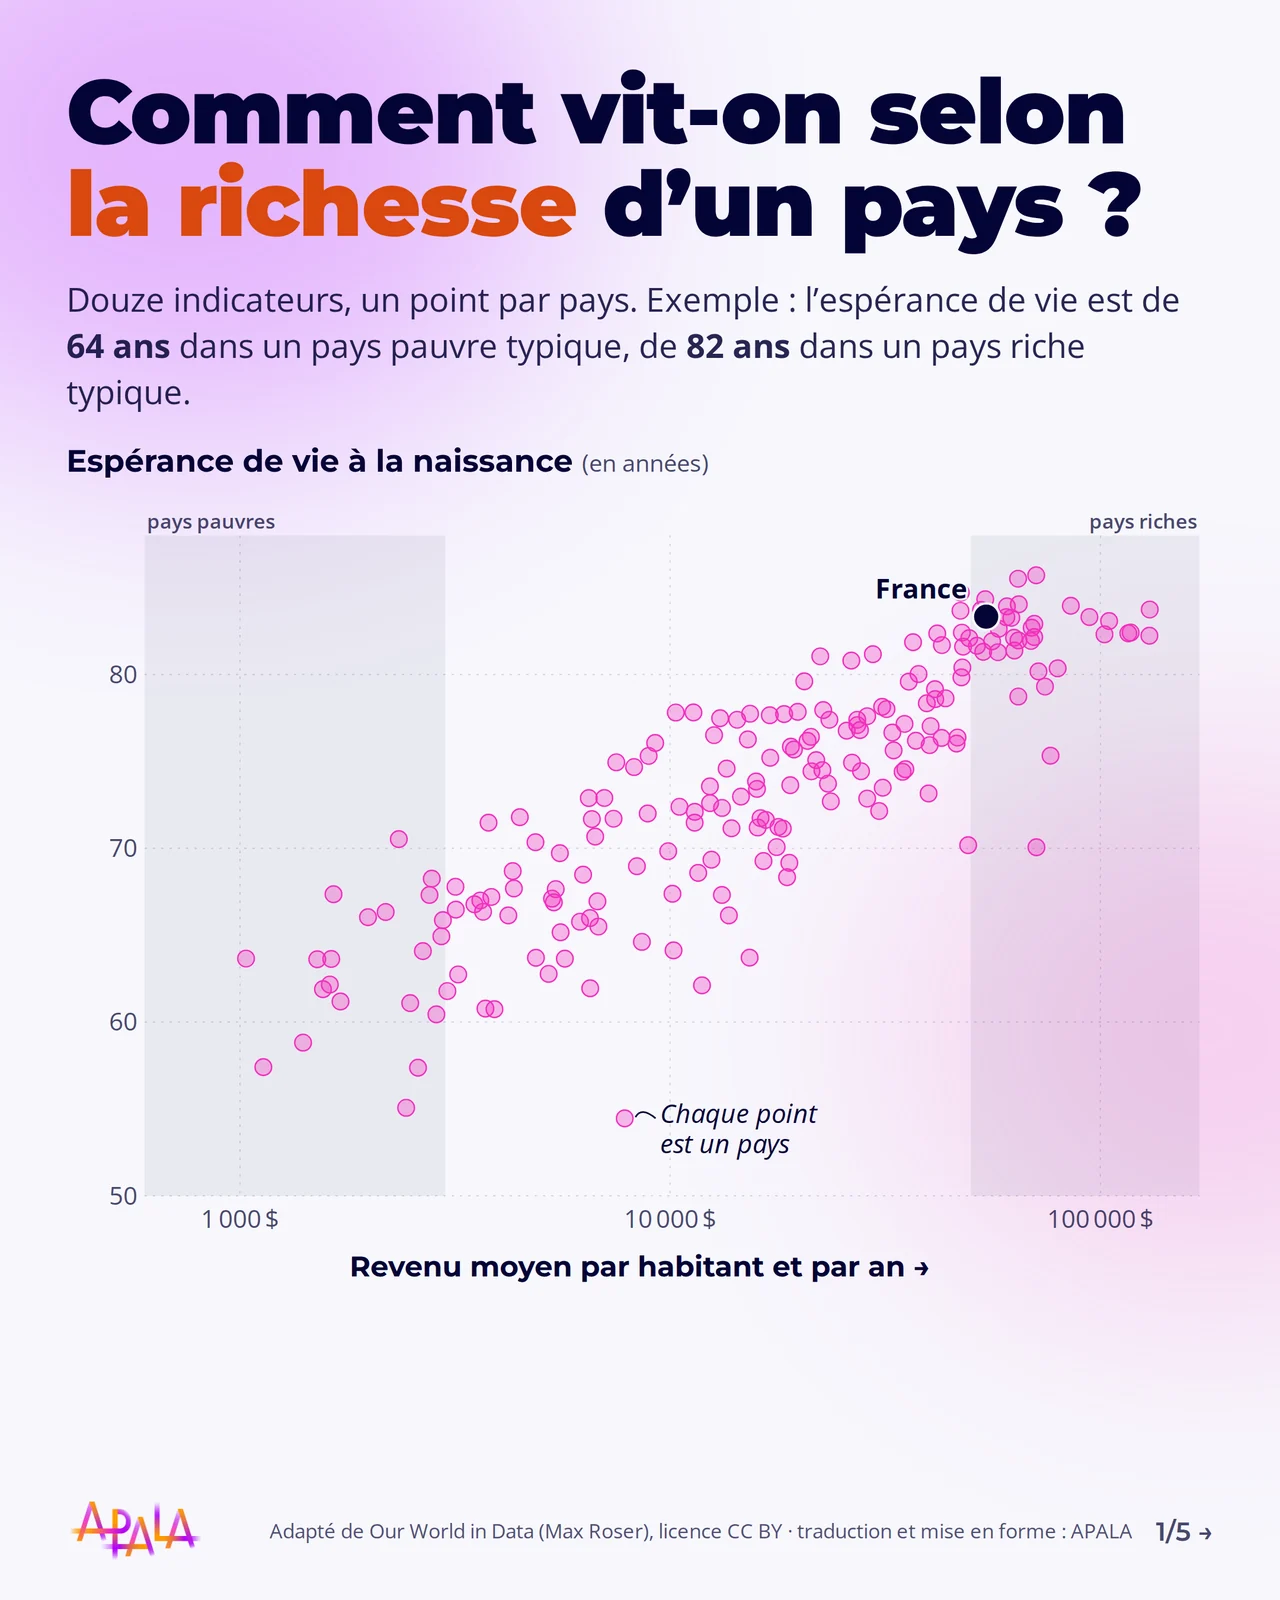
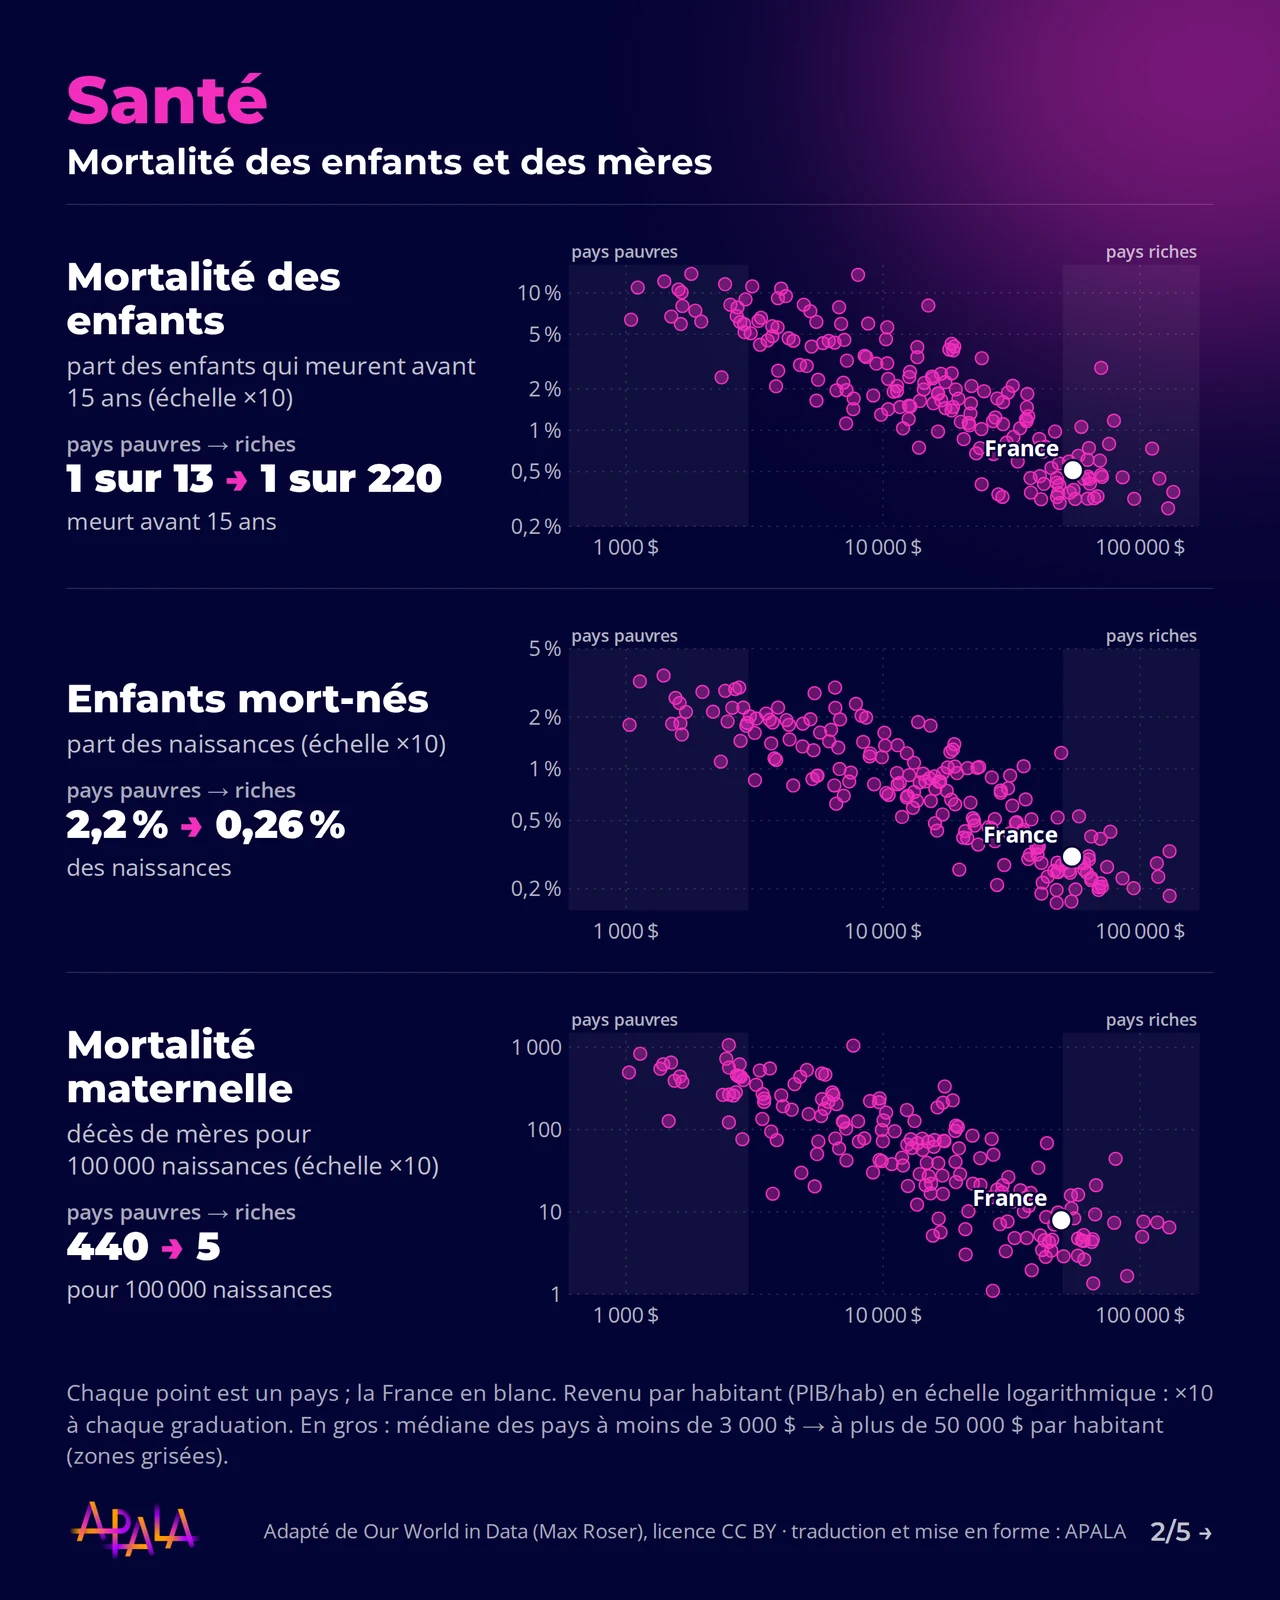
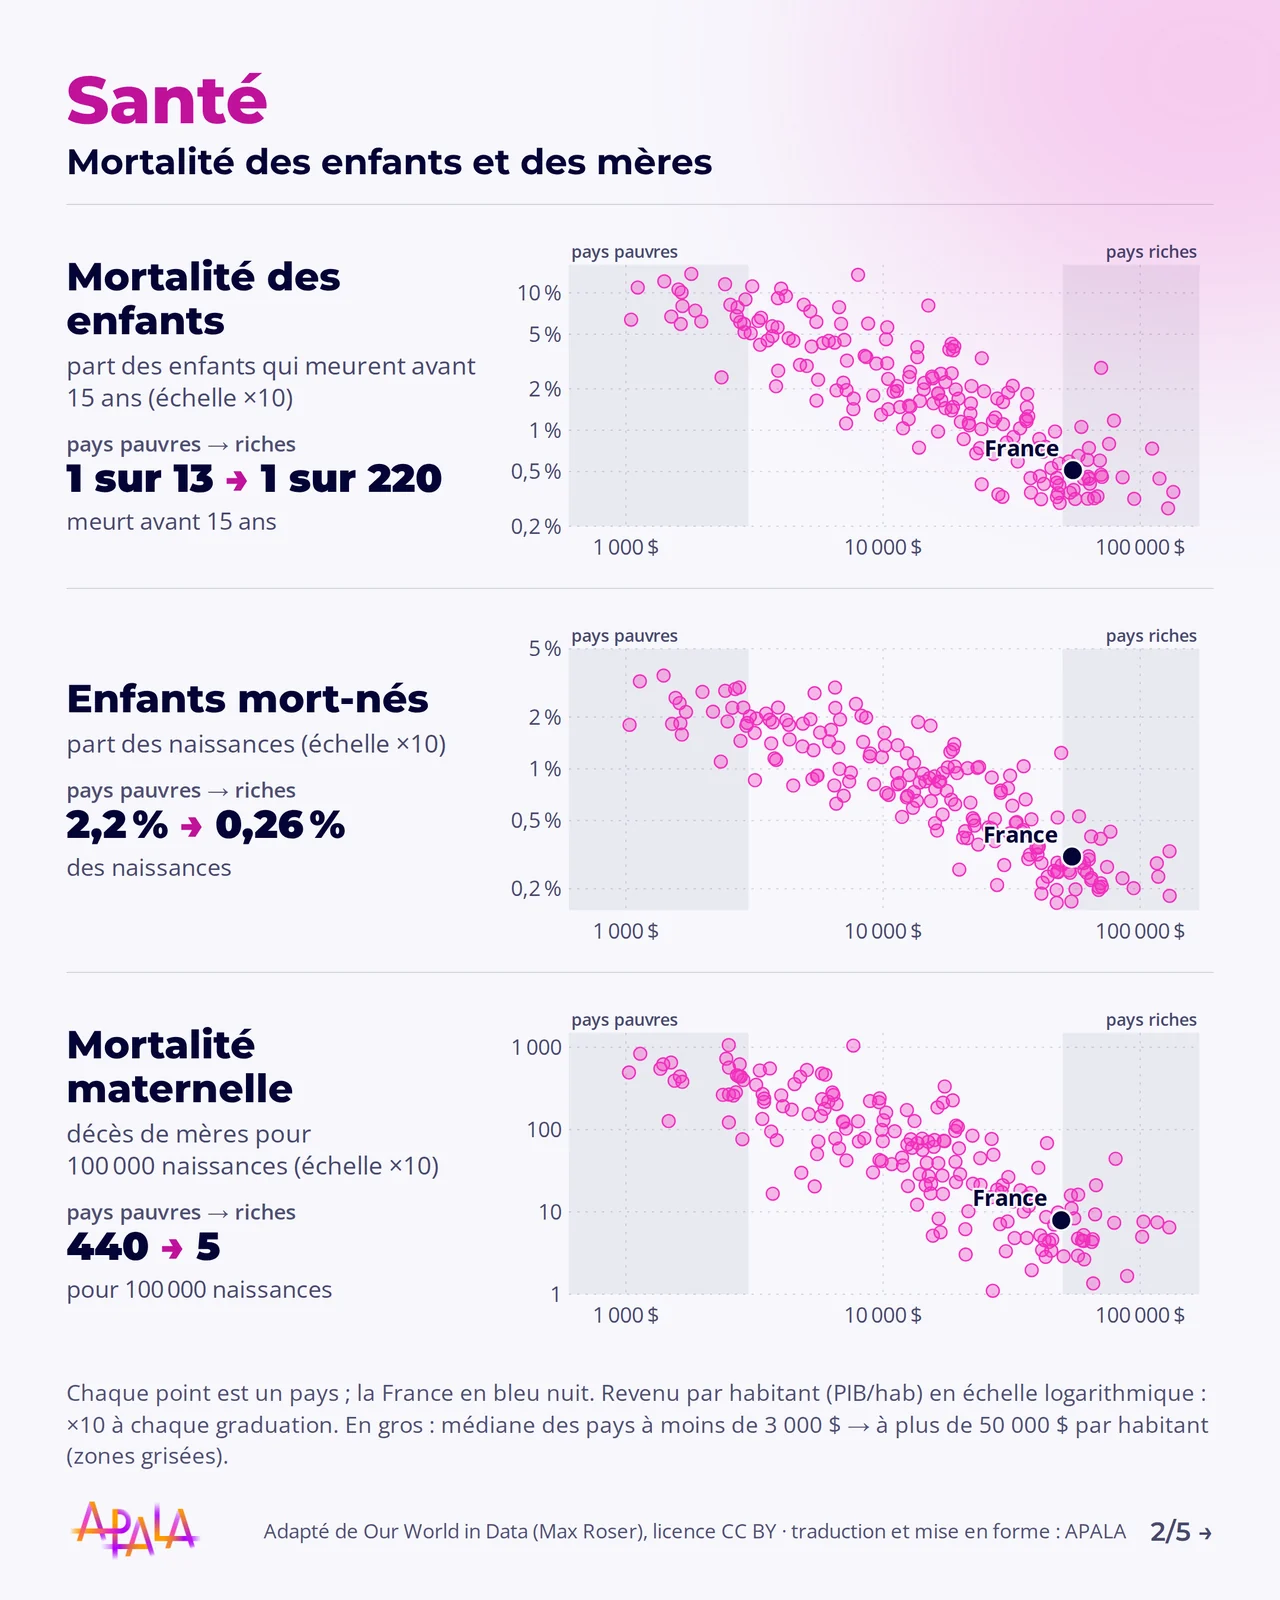
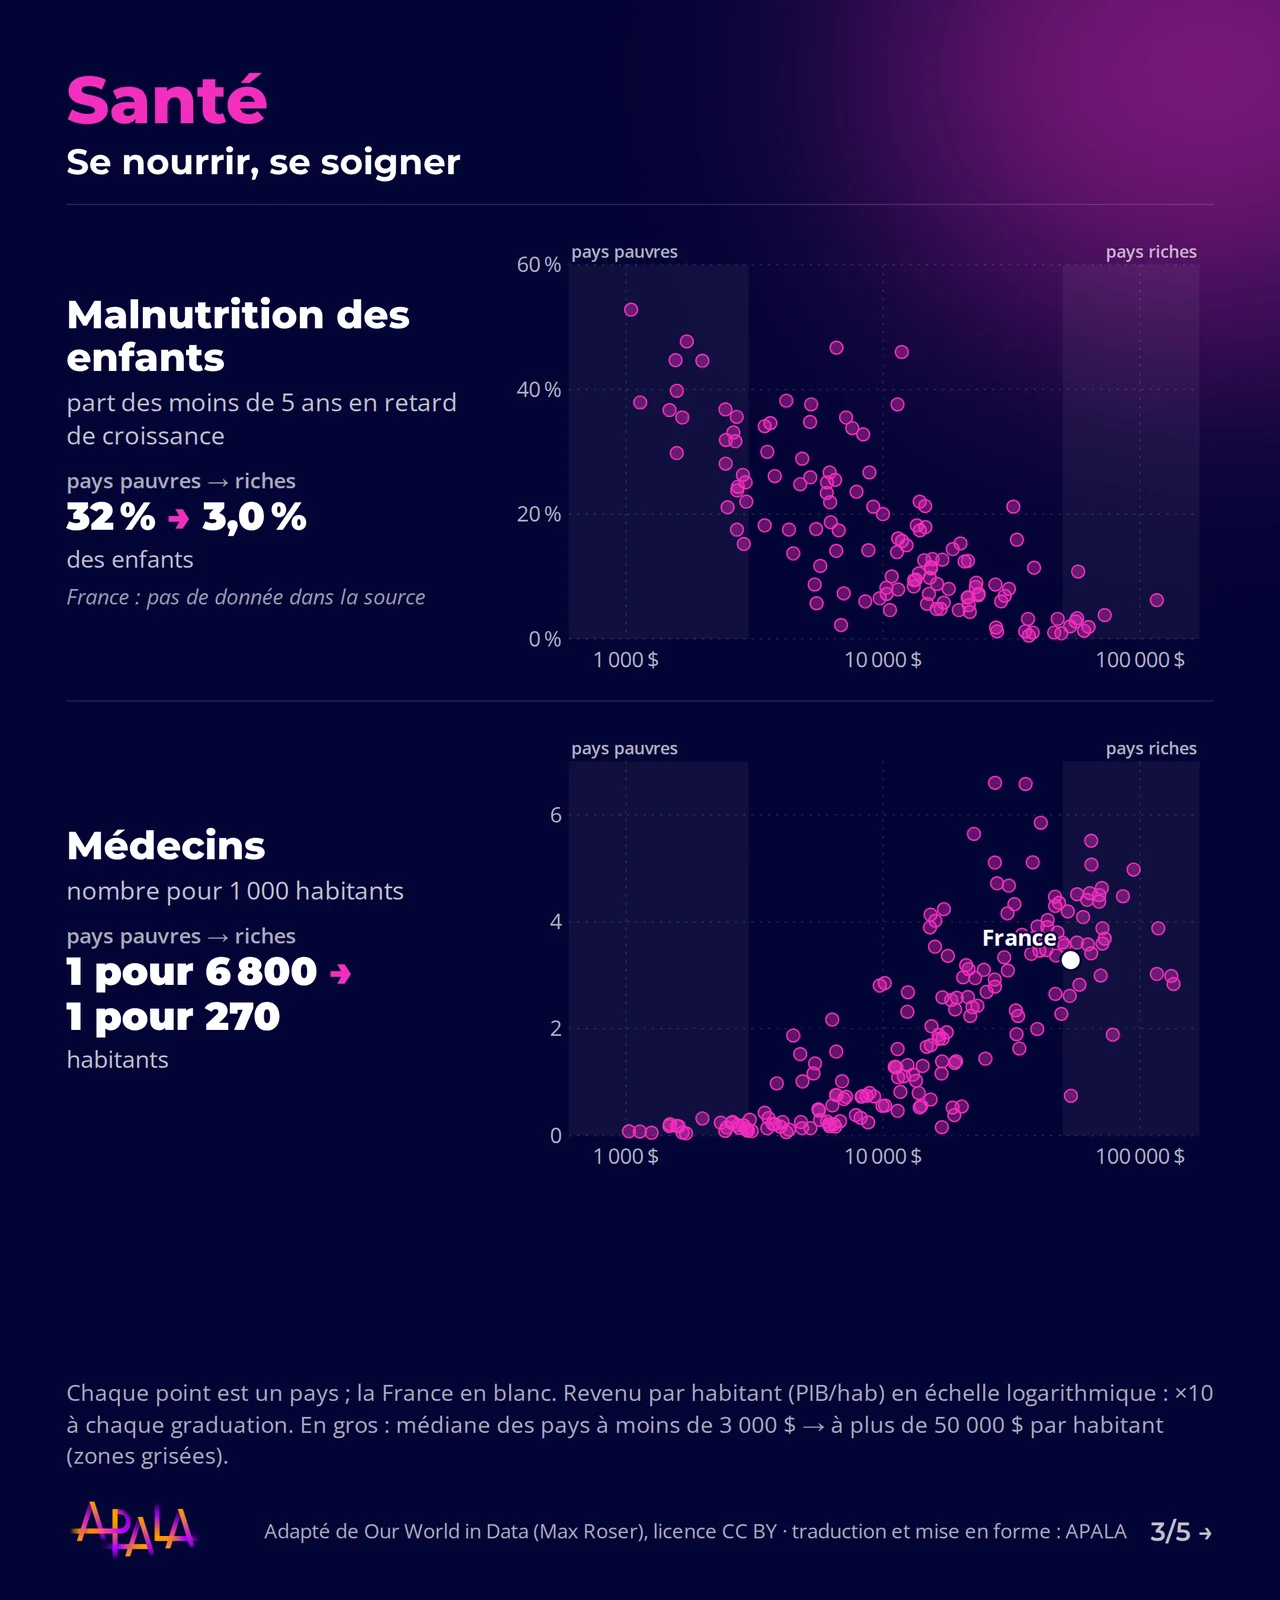
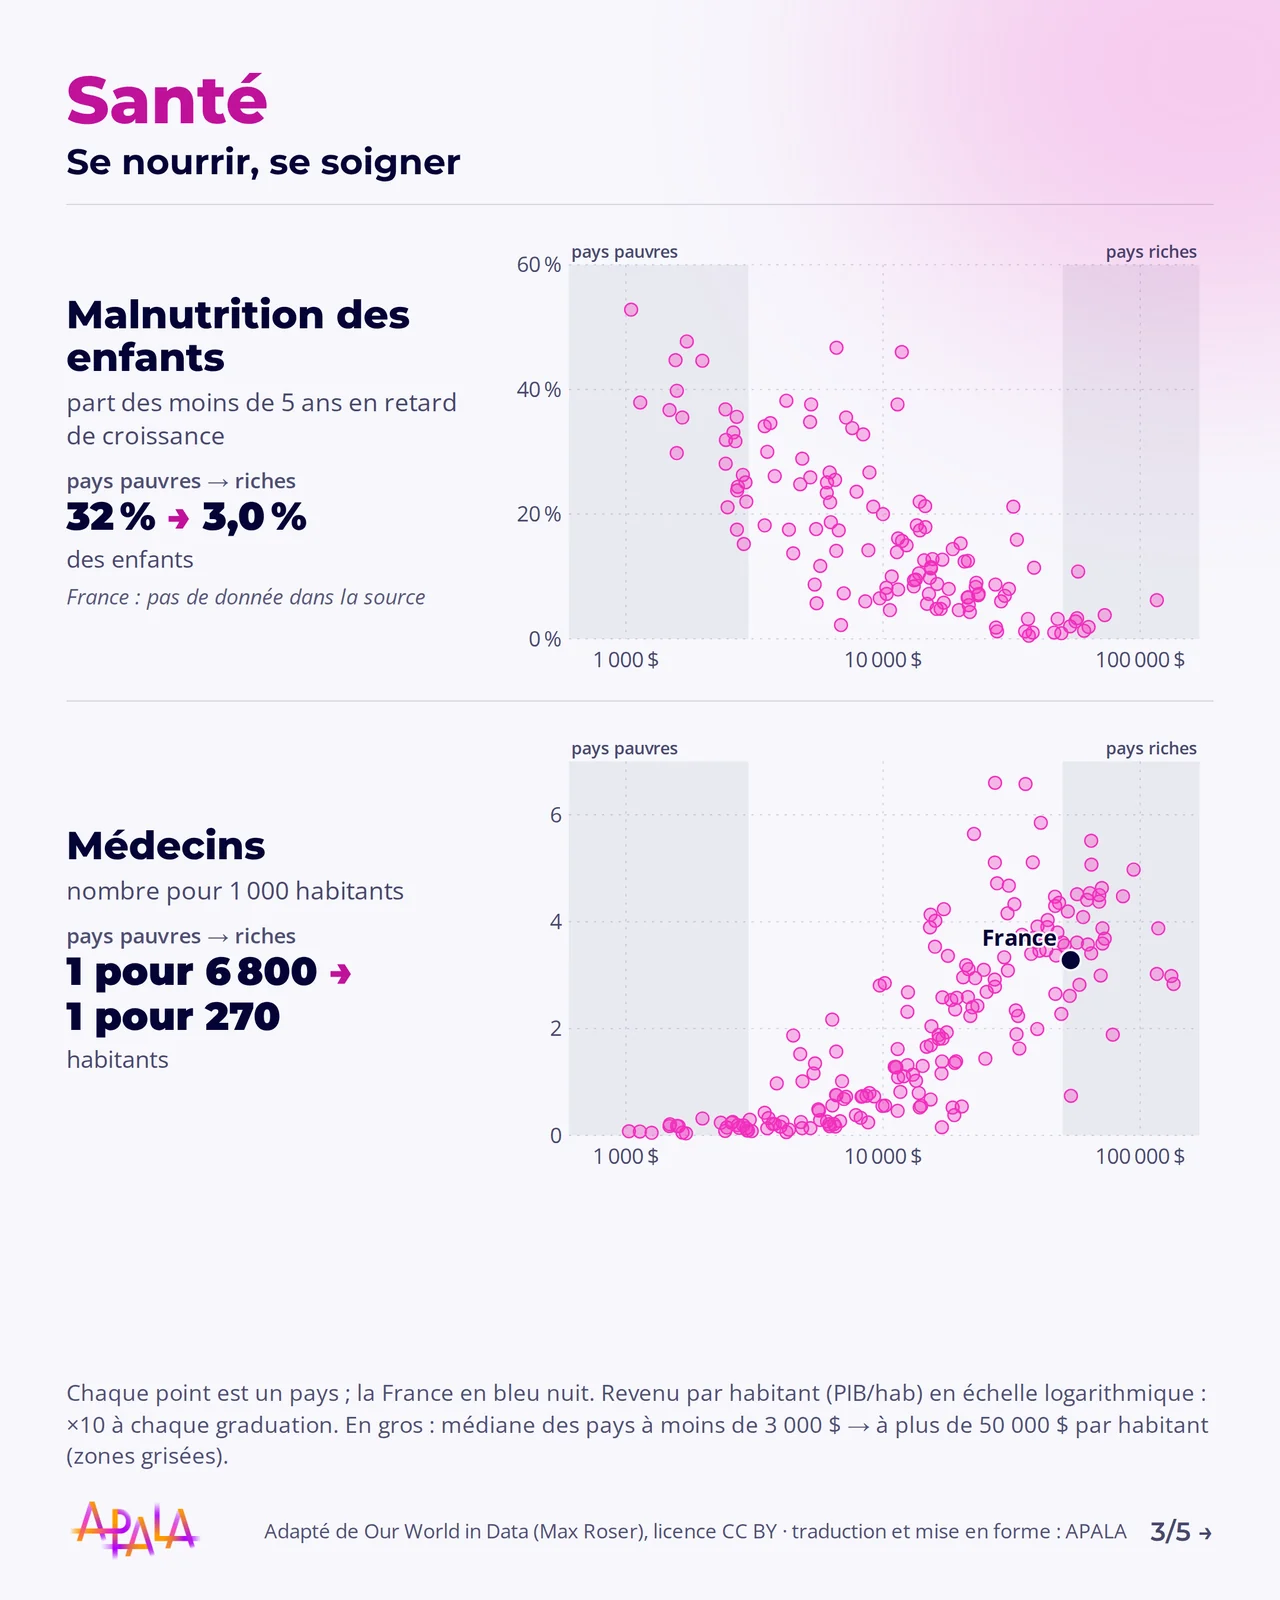
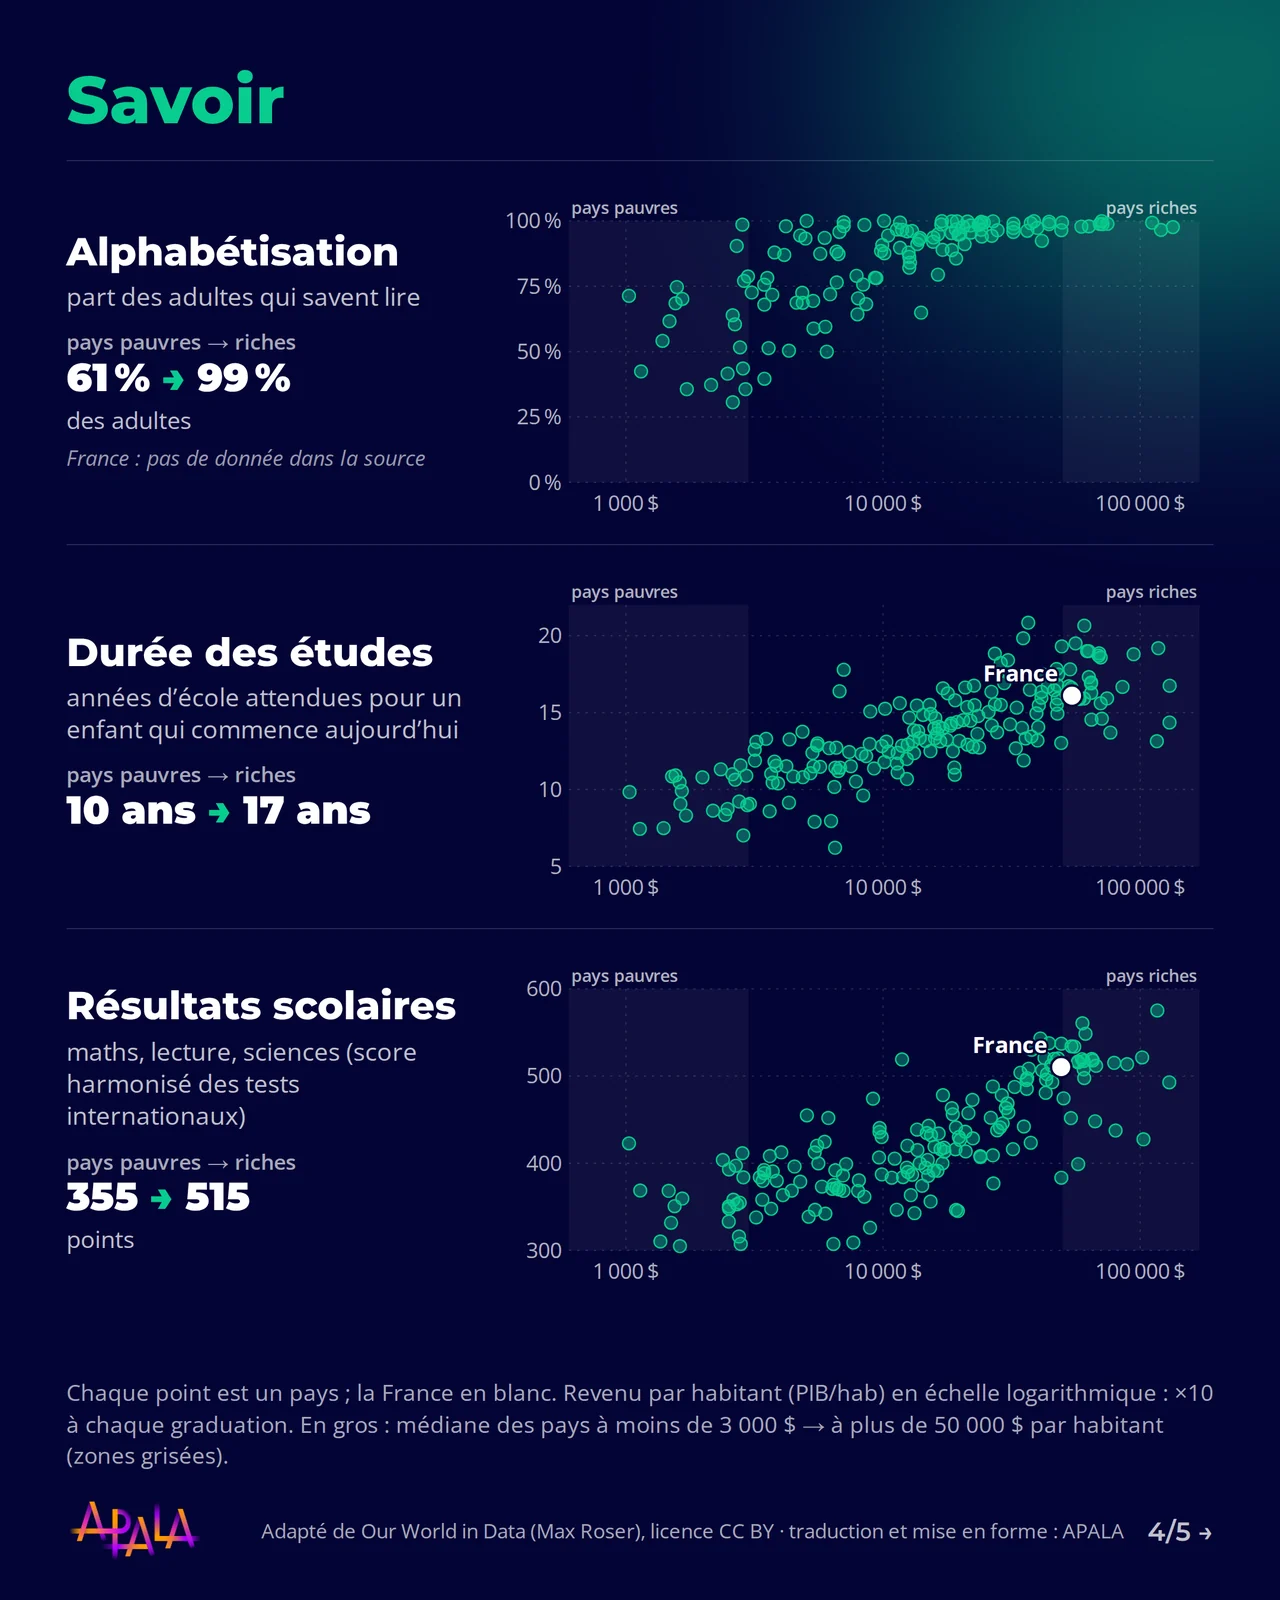
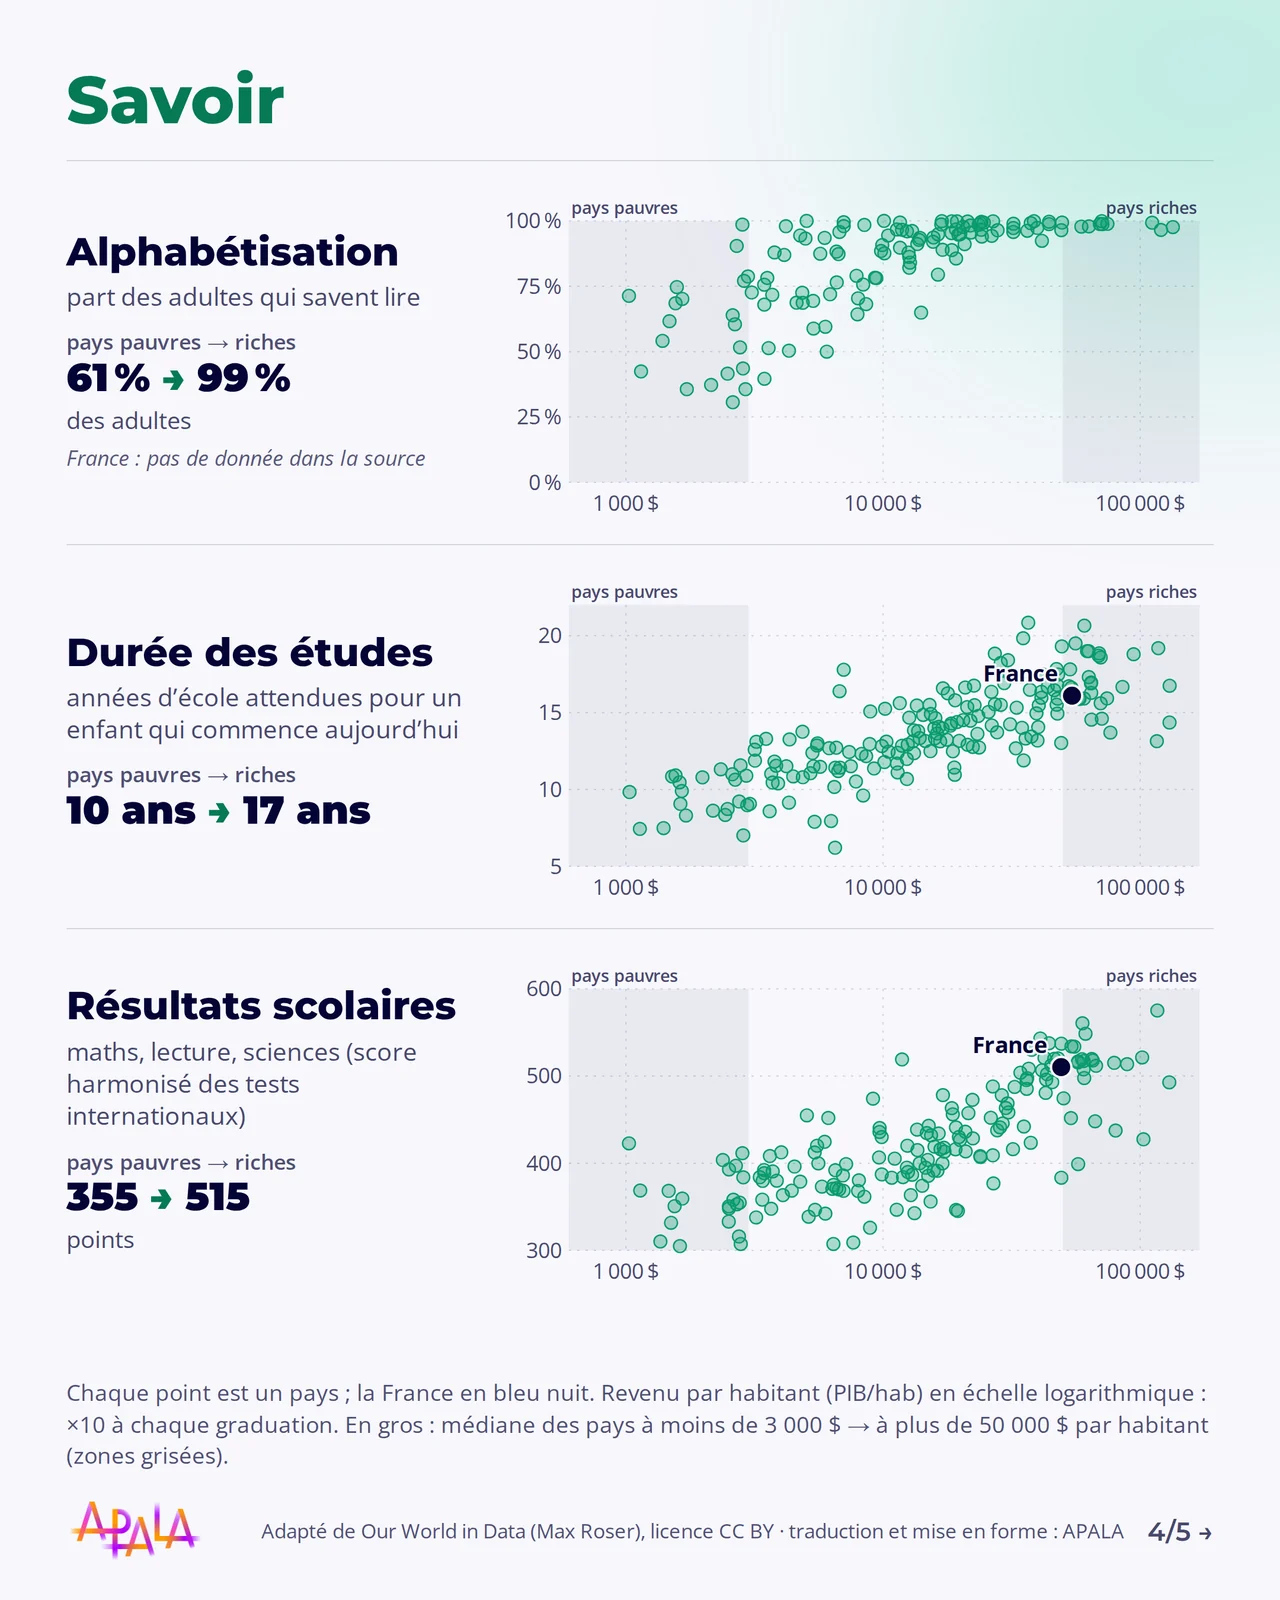
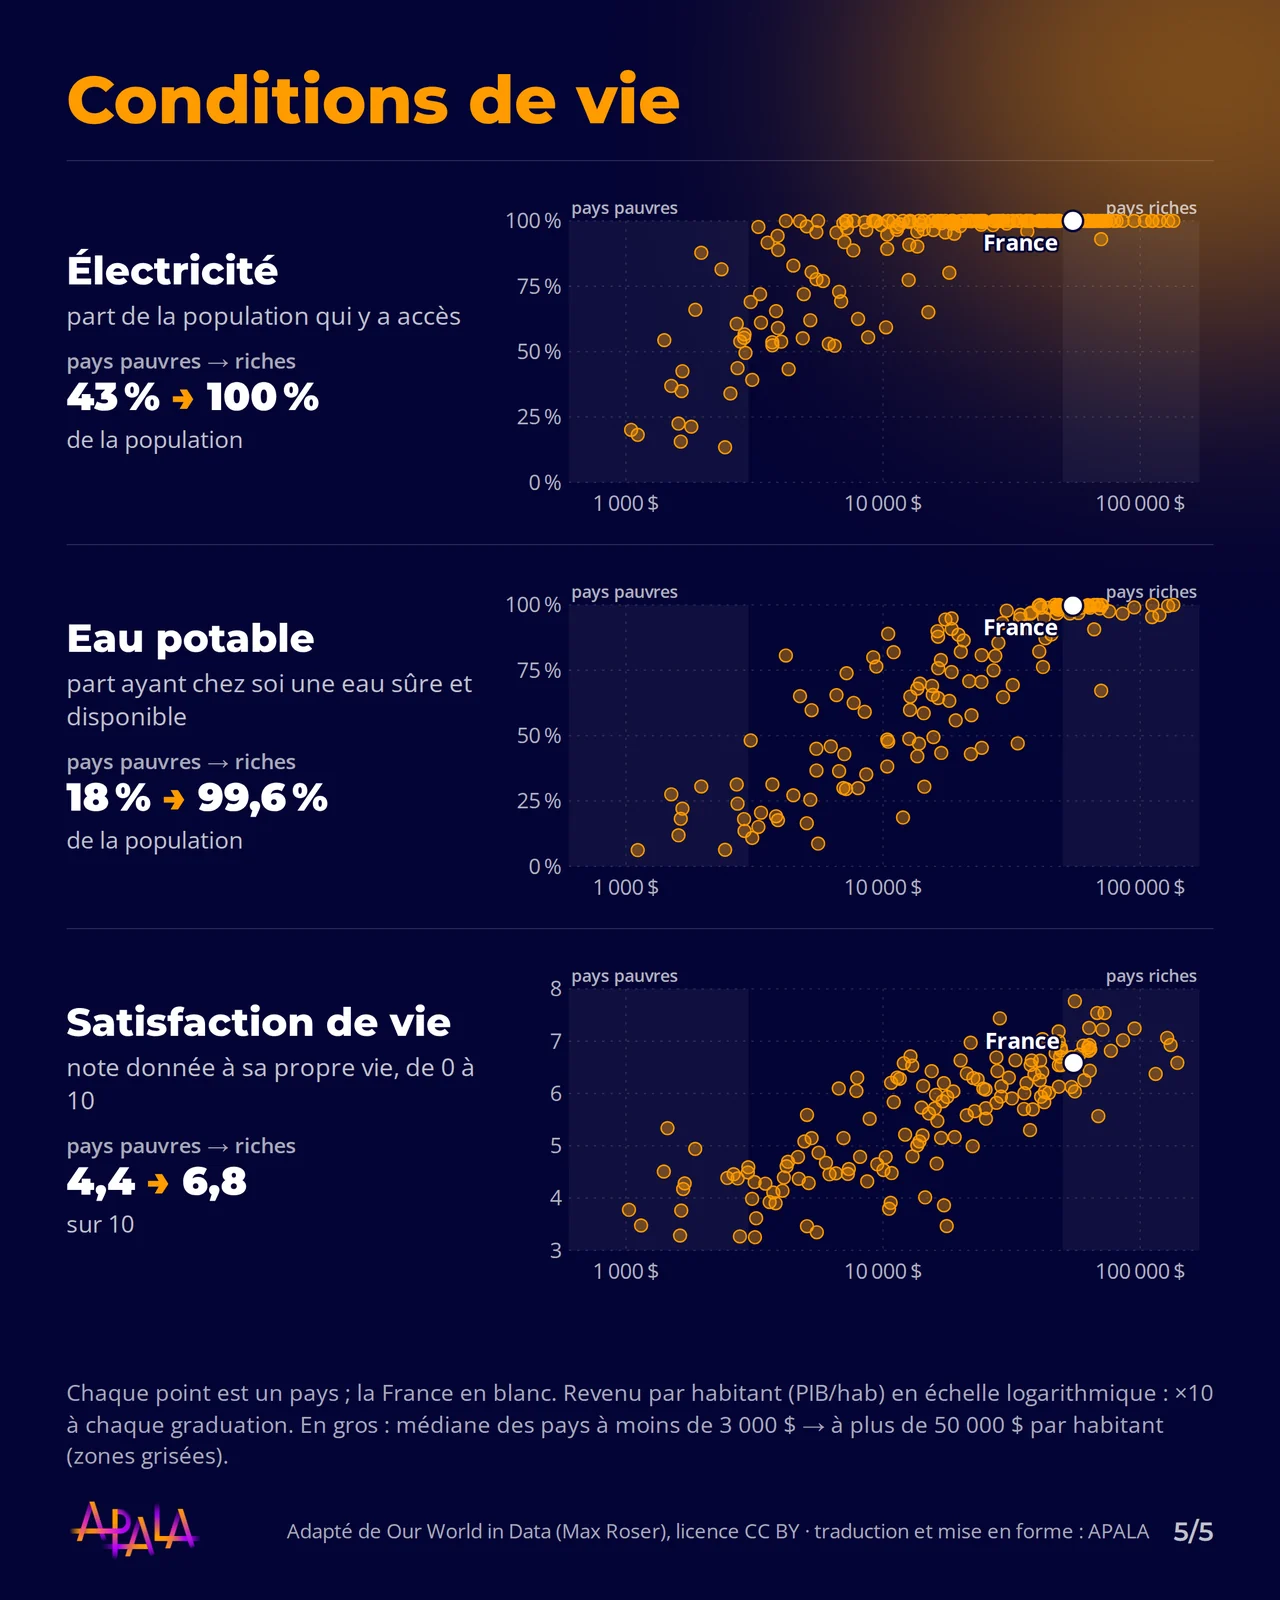
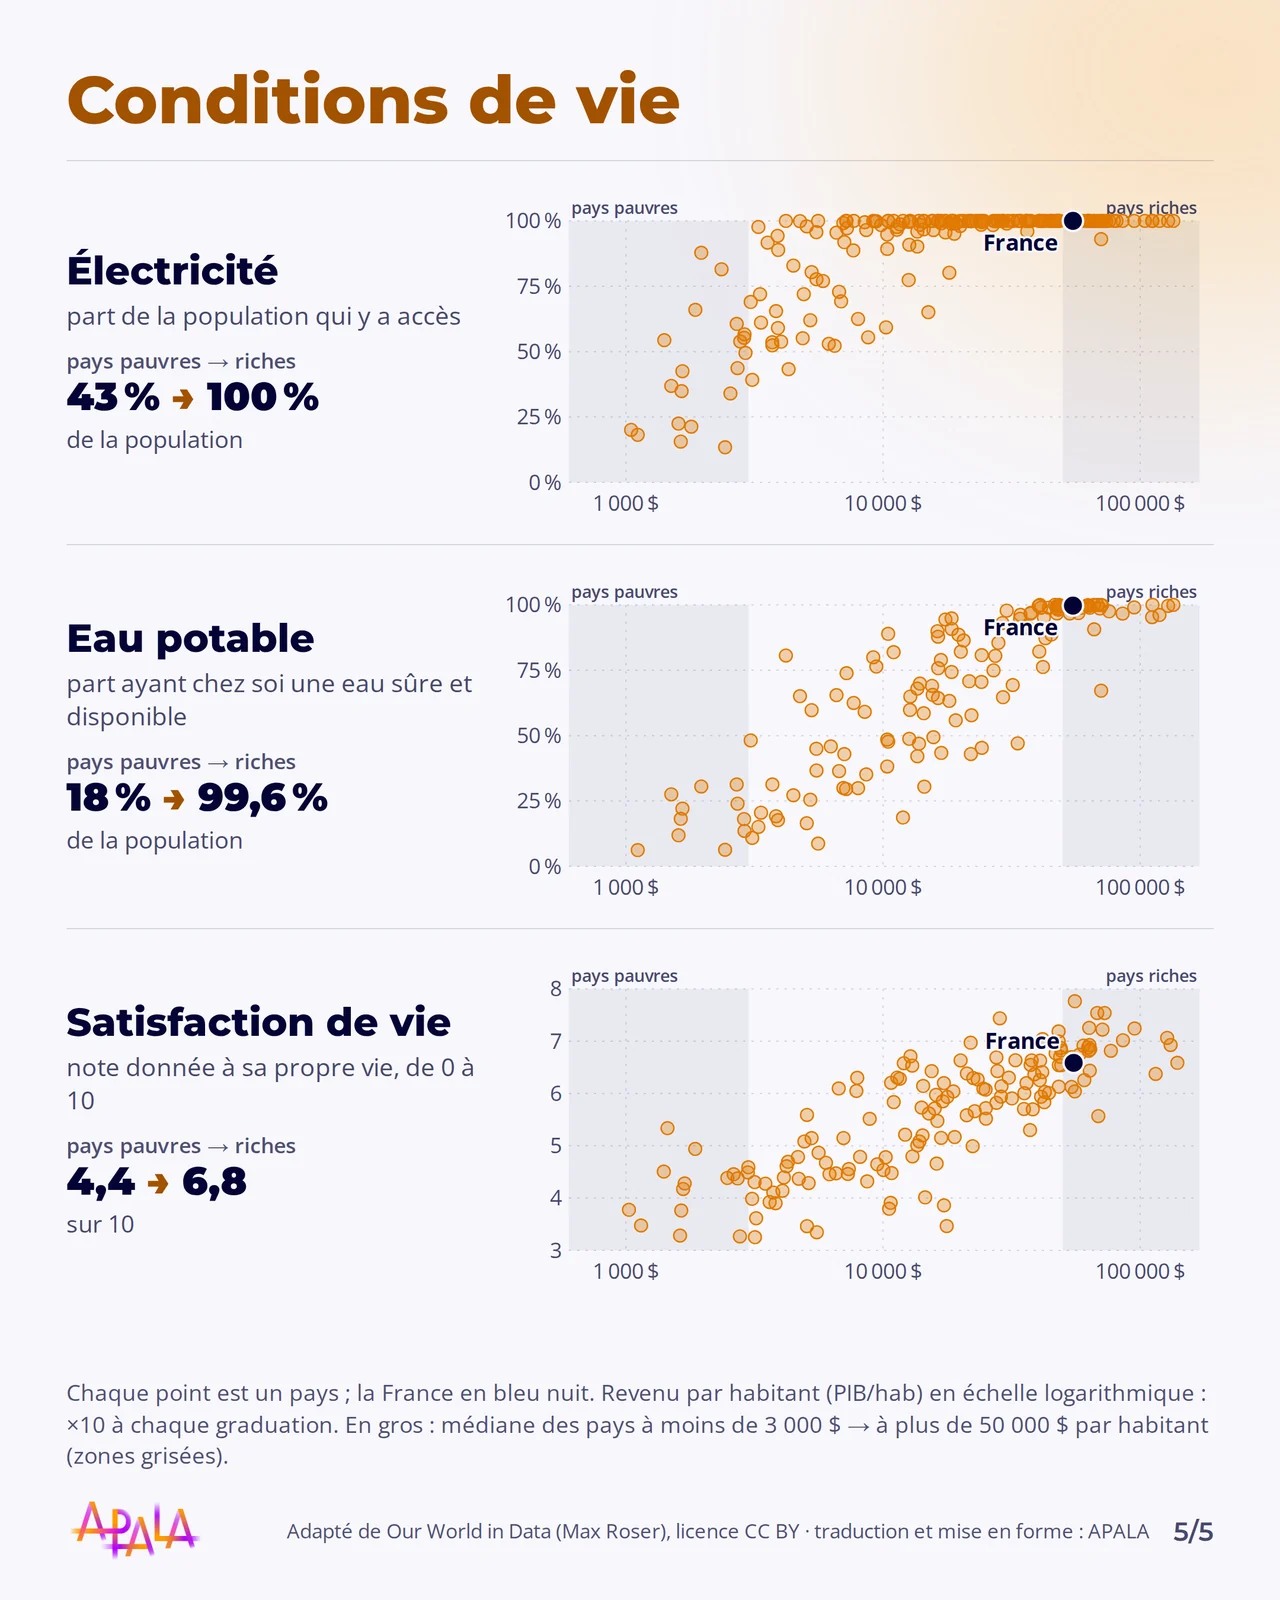
Where GDP per capita is higher, fewer children and mothers die, fewer children go hungry, people live longer, and drinking water and electricity are almost everywhere. The gap is immense: according to our calculations on the same data (medians), around 1 child in 13 dies before the age of 15 in countries with less than $3,000 per capita, compared with 1 in 220 in those with more than $50,000, a risk almost 17 times higher. Max Roser, who compares the poorest and richest countries, writes ‘more than 20 times’ [10]. These are comparisons between countries, not proof that wealth explains everything; but it is wealth that pays for healthcare, vaccines, drinking water, sea walls and warnings.
2. Fewer deaths, despite more disasters in the records
Earthquakes, floods, storms, droughts: in the 1920s, natural disasters killed on average more than 500,000 people a year, around 26 per 100,000 inhabitants. In the 2010s, around 45,000 a year, the Haiti earthquake included, or 0.6 per 100,000: a rate divided by more than 40, while the world’s population quadrupled [11]. Not that hazards have weakened: weather forecasts, warnings, sturdier buildings, more productive agriculture and rescue services protect far better. As older records are incomplete, the decline is probably even underestimated.
The number of recorded disasters, by contrast, has risen four- to fivefold since the 1970s: this is the figure often cited, including by the UN.
Note: this chart counts recorded disasters, not actual disasters. The EM-DAT database has existed only since 1988 (the centre that maintains it, CRED, since 1973). With satellites, the internet and the growth of humanitarian aid, more and more small events, once ignored, have entered the records: the rise from the 1970s to 2000 comes mainly from this. EM-DAT itself advises against reading a trend into it before 2000 and classes these data as ‘historical’. Since 2000, there has been no clear increase: from 325 to 450 disasters or so a year [12]. This does not mean that extremes are not increasing: they are better measured by meteorological records, below.
3. What is really increasing: extreme heat, rainfall and droughts
The IPCC establishes this on the basis of records and models: each half-degree of warming makes heatwaves, heavy rain and, in some regions, droughts markedly more frequent and more intense [13]. How many times today, and tomorrow, does an event occur that would have happened once every ten years without human influence (number of times in ten years):
| ‘Once in 10 years’ event | Today +1°C | +1,5 °C | +2 °C | +4 °C |
|---|---|---|---|---|
| Extreme heat | 2,8 | 4,1 | 5,6 | 9,4 |
| Extreme rainfall (one day) | 1,3 | 1,5 | 1,7 | 2,7 |
| Soil drought, regions that are drying out | 1,7 | 2,0 | 2,4 | 4,1 |
IPCC, 6th Assessment Report, Working Group I, figure SPM.6: central estimates, warming measured relative to 1850-1900 (‘today’: level adopted in 2021). Extreme one-day rainfall gains around 7% in intensity per degree.
Heatwaves already kill in every region of the world (IPCC, very high confidence) [14]. These deaths, mainly cardiovascular, show up in mortality statistics far more than in disaster registers, which count them poorly and which the first chart only partly includes: this is one of the reasons why the two trends coexist. The Lancet Countdown estimates heat-related deaths at around 546,000 a year (2012–2021), with a rate up 23% since the 1990s [15]. Cold still kills far more, in the order of 4.6 million deaths a year against 0.5 million for heat (2000–2019), but the gap is narrowing: from the early 2000s to the late 2010s, the share of deaths attributable to cold fell by about 0.5 points and that of heat rose by about 0.2 points [16]. Warming prevents some of these deaths, mainly in temperate countries, and adds others elsewhere, mainly in hot, poor countries.
4. And tomorrow? What we can reasonably expect
The IPCC projects, with high confidence, that climate change and extreme events will significantly increase illness and premature deaths, with large differences depending on adaptation [14]. The most comprehensive quantified estimate, by Tamma Carleton and her colleagues, gives for 2100, under high emissions, 73 additional deaths per year per 100,000 inhabitants (from 6 to 101 for the central half of simulations), of the same order as all cancers today. Without rising incomes or adaptation, it would be 221; with moderate emissions, 11 [17]. The effects would be highly unequal: mortality would rise by 17% in Accra, Ghana, and fall by 15% in Berlin, thanks to milder winters.
What can reasonably be drawn from this: deaths from floods, storms and cyclones should continue to fall where incomes, warnings and emergency services improve. In Bangladesh, a cyclone could once kill hundreds of thousands of people; death tolls there are now hundreds of times lower [11]. Between the 1980s and 2007-2016, the mortality rate from climate hazards fell by a factor of 6.5 worldwide, but it remains 4.4 times higher in poor countries [18]; between 2010 and 2020, floods, droughts and storms killed 15 times more people in the most vulnerable regions [14]. Heat-related mortality, meanwhile, is expected to rise, all the more so if emissions are high and hot countries remain poor. The outcome depends on three levers at once: emissions, development and adaptation (heatwave plans and warning systems, which the IPCC judges effective).
Extremes are increasing, societies protect themselves better than before, and poverty remains the foremost vulnerability. Cutting emissions and lifting people out of poverty both protect lives: the question for this page remains where each euro saves the most.
Is this work useful to you?
APALA is a public-interest association: our research, our tools and this page are free and will remain so. To keep them going, every donation counts. €10 from you is nearly €30 for us, after tax relief.
- R. D. Bressler, ‘The mortality cost of carbon’, Nature Communications, 12, 4467, 2021: doi.org/10.1038/s41467-021-24487-w (summary and table 1).
- R. D. Bressler, ‘Breaking Down the Mortality and Social Cost of Carbon’, working paper, Columbia University, 21 January 2025, not published in a journal (pp. 4 and 15-16).
- GiveWell, ‘Our Top Charities’, updated October 2026, and ‘How Much Does It Cost To Save a Life?’, April 2024: givewell.org.
- S. Wynes and K. A. Nicholas, ‘The climate mitigation gap’, Environmental Research Letters, 12, 074024, 2017: doi.org/10.1088/1748-9326/aa7541.
- SDES, ‘L’empreinte carbone de la France de 1990 à 2024’, October 2025: statistiques.developpement-durable.gouv.fr.
- Mieux Donner: mieuxdonner.org (recommended charities, tax relief, estimate of around €1 per tonne for climate organisations).
- H. Ritchie and P. Arriagada, ‘How much development aid is spent on climate change?’, Our World in Data, 26 October 2026, based on the OECD RioMarkers database: ourworldindata.org.
- I. Gill and B. Lomborg, ‘The Rich World’s Climate Distraction’, The Wall Street Journal, 1st September 2026 (opinion piece). Figures verified: World Bank Group, 48% of financing with ‘climate co-benefits’ in fiscal year 2025; Copenhagen Consensus, Best Things First and Journal of Benefit-Cost Analysis 14 (S1), 2023: benefit-cost ratios from 18 to 125 across the twelve investments studied (tuberculosis 46, malaria 48, maternal and neonatal health 87, vaccination 101).
- World Bank, Rising to the Challenge: Success Stories and Strategies for Achieving Climate Adaptation and Resilience, 31 October 2024: ‘a 10% increase in GDP per capita would reduce the number of the most vulnerable people by around 100 million’ (press release: worldbank.org).
- M. Roser, ‘How is life at different levels of GDP per capita?’, Our World in Data, 29 October 2026: ourworldindata.org.
- H. Ritchie, P. Rosado and M. Roser, ‘Natural Disasters’, Our World in Data, revised in May 2026, based on EM-DAT, the international disaster database (CRED, UCLouvain): ourworldindata.org. Decade averages read from the chart data.
- H. Ritchie and P. Rosado, ‘Is the number of natural disasters increasing?’, Our World in Data, 3 June 2024: ourworldindata.org.
- IPCC, Climate Change 2021: The Physical Science Basis, 6th Assessment Report, Working Group I, Summary for Policymakers, B.2.2, B.2.4 and figure SPM.6: ipcc.ch.
- IPCC, Climate Change 2022: Impacts, Adaptation and Vulnerability, 6th Assessment Report, Working Group II, Summary for Policymakers, B.1.4, B.2.4, B.4.4, C.2.1 and C.2.11: ipcc.ch.
- M. Romanello et al., ‘The 2025 report of the Lancet Countdown on health and climate change’, The Lancet, 29 October 2025 (figures reproduced by the WHO: who.int).
- Q. Zhao et al., ‘Global, regional, and national burden of mortality associated with non-optimal ambient temperatures from 2000 to 2019’, The Lancet Planetary Health, 5 (7), e415-e425, 2021: doi.org/10.1016/S2542-5196(21)00081-4.
- T. Carleton et al., ‘Valuing the Global Mortality Consequences of Climate Change Accounting for Adaptation Costs and Benefits’, The Quarterly Journal of Economics, 137 (4), 2037-2105, 2022: doi.org/10.1093/qje/qjac020.
- G. Formetta and L. Feyen, ‘Empirical evidence of declining global vulnerability to climate-related hazards’, Global Environmental Change, 57, 2019: doi.org/10.1016/j.gloenvcha.2019.05.004.
- Animals spared: FAO, animals slaughtered by species in France in 2024, via Our World in Data (ourworldindata.org); FranceAgriMer, Les données de la pêche et de l'aquaculture 2025 (2023 consumption: 30.8 kg of aquatic products in live weight per inhabitant, including 21.4 kg of fish) and poultry self-sufficiency rate (82% in 2024); Animal Charity Evaluators, ‘Effects of Diet Choices’, 2021, summarised by Faunalytics (faunalytics.org); H. Sethu, ‘How many animals does a vegetarian save?’, Counting Animals (countinganimals.com); A. Mood and P. Brooke, ‘Estimating global numbers of fishes caught from the wild annually from 2000 to 2019’, Animal Welfare, 2024. Calculation and ranges: APALA.
- C. Grilo et al., ‘Roadkill risk and population vulnerability in European birds and mammals’, Frontiers in Ecology and the Environment, 18 (6), 323-328, 2020: doi.org/10.1002/fee.2216.
- S. Dietz, J. Rising, T. Stoerk and G. Wagner, ‘Economic impacts of tipping points in the climate system’, PNAS, 118 (34), e2103081118, 2021: doi.org/10.1073/pnas.2103081118 (abstract; the authors consider their figures likely to be underestimates).
APALA tool, version of 2 November 2026. The figures will change as new studies emerge.